IBM SPSS Missing Values
- Overview
- Features and Benefits
IBM® SPSS® Missing Values is used by survey researchers, social scientists, data miners, market researchers and others to validate data.
Missing data can seriously affect your models – and your results. Ignoring missing data, or assuming that excluding missing data is sufficient, risks reaching invalid and insignificant results. To ensure that you take missing values into account, make IBM SPSS Missing Values part of your data management and preparation.
Uncover Missing Data Patterns
- Easily examine data from several different angles using one of six diagnostic reports, then estimate summary statistics and impute missing values
- Quickly diagnose serious missing data imputation problems
- Replace missing values with estimates
- Display a snapshot of each type of missing value and any extreme values for each case
- Remove hidden bias by replacing missing values with estimates to include all groups ¬– even those with poor responsiveness
Uncover Missing Data Patterns
With IBM SPSS Missing Values, you can easily examine data from several different angles using one of six diagnostic reports to uncover missing data patterns. You can then estimate summary statistics and impute missing values through regression or expectation maximization algorithms (EM algorithms).
IBM SPSS Missing Values helps you to:
- Diagnose if you have a serious missing data imputation problem
- Replace missing values with estimates -- for example, impute your missing data with the regression or EM algorithms
Quickly and Easily Diagnose Your Missing Data
Quickly diagnose a serious missing data problem using the data patterns report, which provides a case-by-case overview of your data. This report helps you determine the extent of missing data; it displays a snapshot of each type of missing value and any extreme values for each case.
Reach More Valid Conclusions
Replace missing values with estimates and increase the chance of receiving statistically significant results. Remove hidden bias from your data by replacing missing values with estimates to include all groups in your analysis – even those with poor responsiveness.
Use Multiple Imputation to Replace Missing Data Values
IBM SPSS Missing Values' multiple imputation procedure will help you understand patterns of “missingness” in your dataset and enable you to replace missing values with plausible estimates. It offers a fully automatic imputation mode that chooses the most suitable imputation method based on characteristics of your data, while also allowing you to customize your imputation model.
Several complete datasets are generated (typically, three to five), each with a different set of replacement values. Next, you can model the individual datasets, using techniques such as linear regression, to produce parameter estimates for each dataset. Then you can obtain final parameter estimates. This involves pooling the individual sets of parameter estimates obtained in step two and computing inferential statistics that take into account variation within and between imputations.
Analysis of the individual datasets and pooling of the results are supported via existing IBM SPSS Statistics procedures such as REGRESSION. When operating on datasets with imputed values, existing procedures will automatically produce pooled parameter estimates.
Fill in the Blanks for Improved Data Management
IBM SPSS Missing Values has the statistics you need to fill in missing data:
- Univariate: compute count, mean, standard deviation, and standard error of mean for all cases excluding those containing missing values, count and percent of missing values, and extreme values for all variables
- Listwise: compute mean, covariance matrix, and correlation matrix for all quantitative variables for cases excluding missing values
- Pairwise: compute frequency, mean, variance, covariance matrix, and correlation matrix
- Expectation maximization (EM) algorithm
- Estimate the means, covariance matrix, and correlation matrix of quantitative variables with missing values, assuming normal distribution, t distribution with degrees of freedom, or a mixed-normal distribution with any mixture proportion and any standard deviation ratio
- Impute missing data and save the completed data as a file
- Regression algorithm
- Estimate the means, covariance matrix, and correlation matrix of variables set as dependent; set number of predictor variables; set random elements as normal, t, residuals, or none
IBM SPSS Missing Values also has features that enable you to analyze patterns and manage data, including the ability to:
- Display missing data and extreme cases for all cases and all variables using the data patterns table
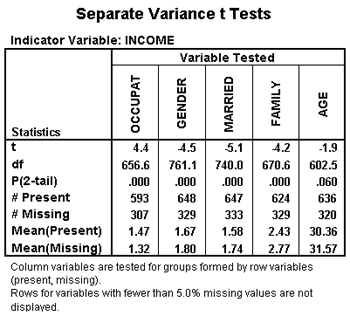
- Determine differences between missing and non-missing groups for a related variable with the separate t test table
- Assess how much missing data for one variable relates to the missing data of another variable using the percent mismatch of patterns table
This separate variance t test table defines two groups of cases: those with data on income and those that are missing data on income. Then, the separate variance t test table tests to see if these two groups are different from each other on a series of variables. This table shows that people with missing data on income are more likely to have a non-professional occupation, more likely to be female, more likely to be married, and have a larger family than people who reported information on their family income.

