IBM SPSS Custom Tables
Easily analyze and communicate your analytical results
- Overview
- Features and Benefits
IBM® SPSS® Custom Tables helps you easily understand your data and quickly summarize your results in different styles for different audiences.
More than a simple reporting tool, IBM SPSS Custom Tables combines comprehensive analytical capabilities with interactive table-building features to help you learn from your data and communicate the results of your analyses as professional-looking tables that are easy to read and interpret.
- Compare means or proportions for demographic groups, customer segments, time periods or other categorical variables when you include inferential statistics
- Select summary statistics - from simple counts for categorical variables to measures of dispersion - and sort categories by any summary statistic used
- Choose from three significance tests: Chi-square test of independence, comparison of column means (t test), or comparison of column proportions (z test)
- Drag and drop variables onto the interactive table builder to create results as pivot tables
- Preview tables in real time and modify them as you create them
- Exclude specific categories, display missing value cells and add subtotals to your tables
- Export tables to Microsoft® Word, Excel®, PowerPoint® or HTML for use in reports

IBM SPSS Custom Tables is an analytical tool that helps you augment your reports with information your readers need to make more informed decisions.
Use inferential statisticsalso known as significance testingin your tables to perform common analyses: Compare means or proportions for demographic groups, customer segments, time periods, or other categorical variables; and identify trends, changes, or major differences in your data. IBM SPSS Custom Tables includes the following significance tests:
- Chi-square test of independence
- Comparison of column means (t test)
- Comparison of column proportions (z test)
You can also choose from a variety of summary statistics, which include everything from simple counts for categorical variables to measures of dispersion. Summary statistics are included for:
- Categorical variables
- Multiple response sets
- Scale variables
- Custom total summaries for categorical variables
When your analysis is complete, you can use IBM SPSS Custom Tables to create customized tabular reports suitable for a variety of audiencesincluding those without a technical background.
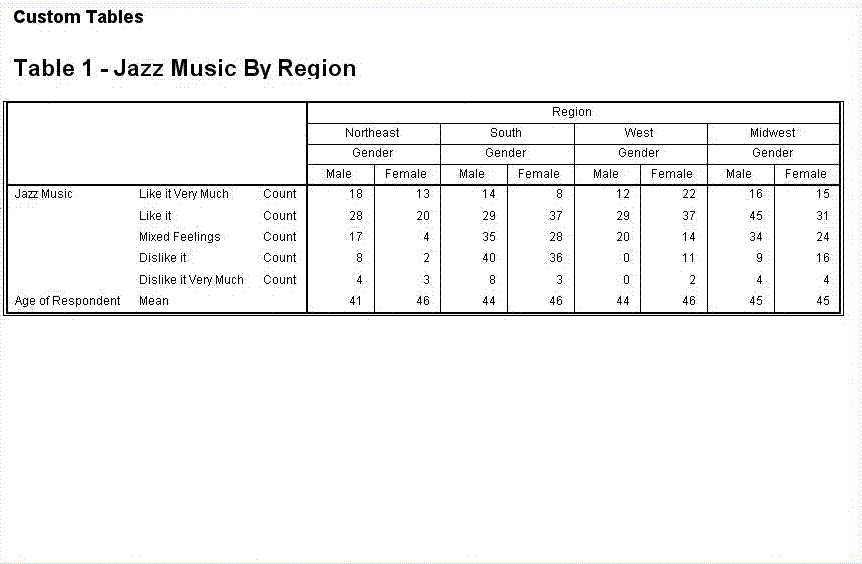
Choose from a variety of summary statistics and link multiple tables together. In this example, preference by gender and region are quickly extracted from survey data with IBM SPSS Custom Tables.
Preview your tables during production
With IBM SPSS Custom Tables' interactive table preview builder (see the figure below), you see how your tables look as you create or modify them. You can make adjustments along the way, ensuring that your final table is exactly what you need. For example, you can:
- Move variables from row to column
- Collapse large or complex tables for a more concise view
- View variable categories while you work with themand before you add them to your tables
- Preview the arrangement of variables (e.g., dimensions, stacking, or nesting), the categories of each variable, and requested statistics
Customize table layout and appearance
IBM SPSS Custom Tables gives you a high level of control over the layout and appearance of your tables. For example, you can:
- Create totals and subtotals without changing your data file
- Make your tables more precise by changing variable types or excluding categories
- Sort categories by any summary statistic in your table and hide the categories that comprise subtotals
- Select from 16 pre-formatted styles in TableLooks (found within IBM SPSS Statistics Base) or create your own styles. Through Statistics Base, you can also add boldface lines; draw lines; align left, right, or center; and specify titles and footnotes.
Make your results available easily
IBM SPSS Custom Tables helps you improve your workflow by producing all results as IBM SPSS pivot tables. You can easily export them to Microsoft® Word or Excel® with your formatting intact, so your information gets to the right people-quickly and accurately.
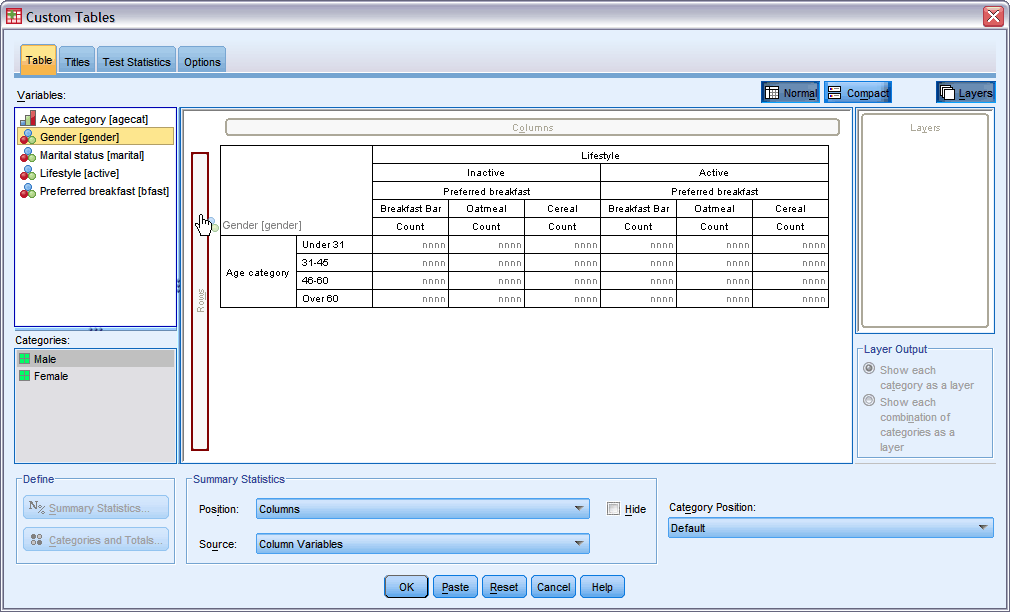
Use the interactive table preview builder to view and adjust your table during production. In this example, "Age Category" is placed in the rows and is about to be broken down further by "Gender"; "Lifestyle" is placed in the columns and broken down by preference of breakfast. The addition of the layer "Marital Status" will result in three tables: married, divorced and single.