IBM SPSS Categories
Predict outcomes and reveal relationships in categorical data
- Overview
- Features and Benefits
IBM® SPSS® Categories provides you with all the tools you need to obtain clear insight into complex categorical and numeric data, as well as high-dimensional data.
Use IBM SPSS Categories to understand which characteristics consumers relate most closely to your brand, or to determine customer perception of your products compared to other products you or your competitors offer.
- Discover underlying relationships through perceptual maps, bi plots and tri plots
- Work with and understand nominal (e.g. salary) and ordinal (e.g. education level) data with procedures similar to conventional regression, principal components and canonical correlation to predict outcomes and reveal relationships
- Visually interpret datasets and see how rows and columns relate in large tables of scores, counts, ratings, rankings or similarities
- Deal with non-normal residuals in numeric data or nonlinear relationships between predictor variables (e.g. customer or product attributes) and the outcome variable (e.g. purchase/non-purchase)
- Use Ridge Regression, the Lasso, the Elastic Net, variable selection and model selection for both numeric and categorical data

Unleash the full potential of your data through predictive analysis, statistical learning, perceptual mapping, preference scaling and dimension reduction techniques including optimal scaling of your variables.
Graphically display underlying relationships
IBM SPSS Categories dimension reduction techniques enable you to clarify relationships in your data by using perceptual maps and biplots:
- Perceptual maps are high-resolution summary charts that graphically display similar variables or categories close to each other. They provide you with unique insight into relationships between more than two categorical variables.
- Biplots and triplots enable you to look at the relationships among cases, variables and categories. For example, you can define relationships between products, customers and demographic characteristics.
By using the preference scaling feature, you can further visualize relationships among objects. The breakthrough algorithm on which this procedure is based enables you to perform non-metric analyses for ordinal data and obtain meaningful results. The proximities scaling procedure allows you to analyze similarities between objects, and incorporate characteristics for objects in the same analysis.
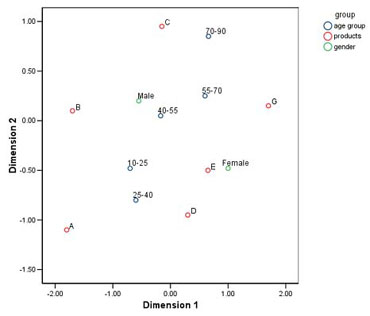
The data are a 2x5x6 table containing information on two genders, five age groups and six products. This plot shows the results of a two-dimensional multiple correspondence analysis of the table. Notice that products such as "A" and "B" are chosen at younger ages and by males, while products such as "G" and "C" are preferred at older ages.
Turn qualitative variables into quantitative ones
Perform additional statistical operations on categorical data with the advanced procedures available in IBM SPSS Categories:
- Use optimal scaling procedures to assign units of measurement and zero-points to your categorical data
- Choose from state-of-the art procedures for model selection and regularization
- Perform correspondence and multiple correspondence analyses to numerically evaluate similarities between two or more nominal variables in your dataset
- Summarize your data according to important components by using principal components analysis
- Quantify your ordinal and nominal variables with an optimal scaling correlation matrix
- Use nonlinear canonical correlation analysis to incorporate and analyze variables of different measurement levels
Procedures and statistics for analyzing categorical data
Using IBM SPSS Categories with IBM SPSS Statistics Base gives you a selection of statistical techniques for analyzing high-dimensional or categorical data, including:
- Categorical regression that predicts the values of a nominal, ordinal or numerical outcome variable from a combination of categorical predictor variables. Optimal scaling techniques are used to quantify variables. Three regularization methods: Ridge regression, the Lasso and the Elastic Net, improve prediction accuracy by stabilizing the parameter estimates.
- Correspondence analysis that enables you to analyze two-way tables that contain some measurement of correspondence between rows and columns, as well as display rows and columns as points in a map.
- Multiple correspondence analysis which is used to analyze multivariate categorical data by allowing the use of more than two variables in your analysis. With this procedure, all the variables are analyzed at the nominal level (unordered categories).
- Categorical principal components analysis uses optimal scaling to generalize the principal components analysis procedure so that it can accommodate variables of mixed measurement levels.
- Nonlinear canonical correlation analysis uses optimal scaling to generalize the canonical correlation analysis procedure so that it can accommodate variables of mixed measurement levels. This type of analysis enables you to compare multiple sets of variables to one another in the same graph, after removing the correlation within sets.
- Multidimensional scaling performs multidimensional scaling of one or more matrices with similarities or dissimilarities (proximities).
- Preference scaling visually examines relationships between two sets of objects, for example, consumers and products. Preference scaling performs multidimensional unfolding in order to find a map that represents the relationships between these two sets of objects as distances between two sets of points.